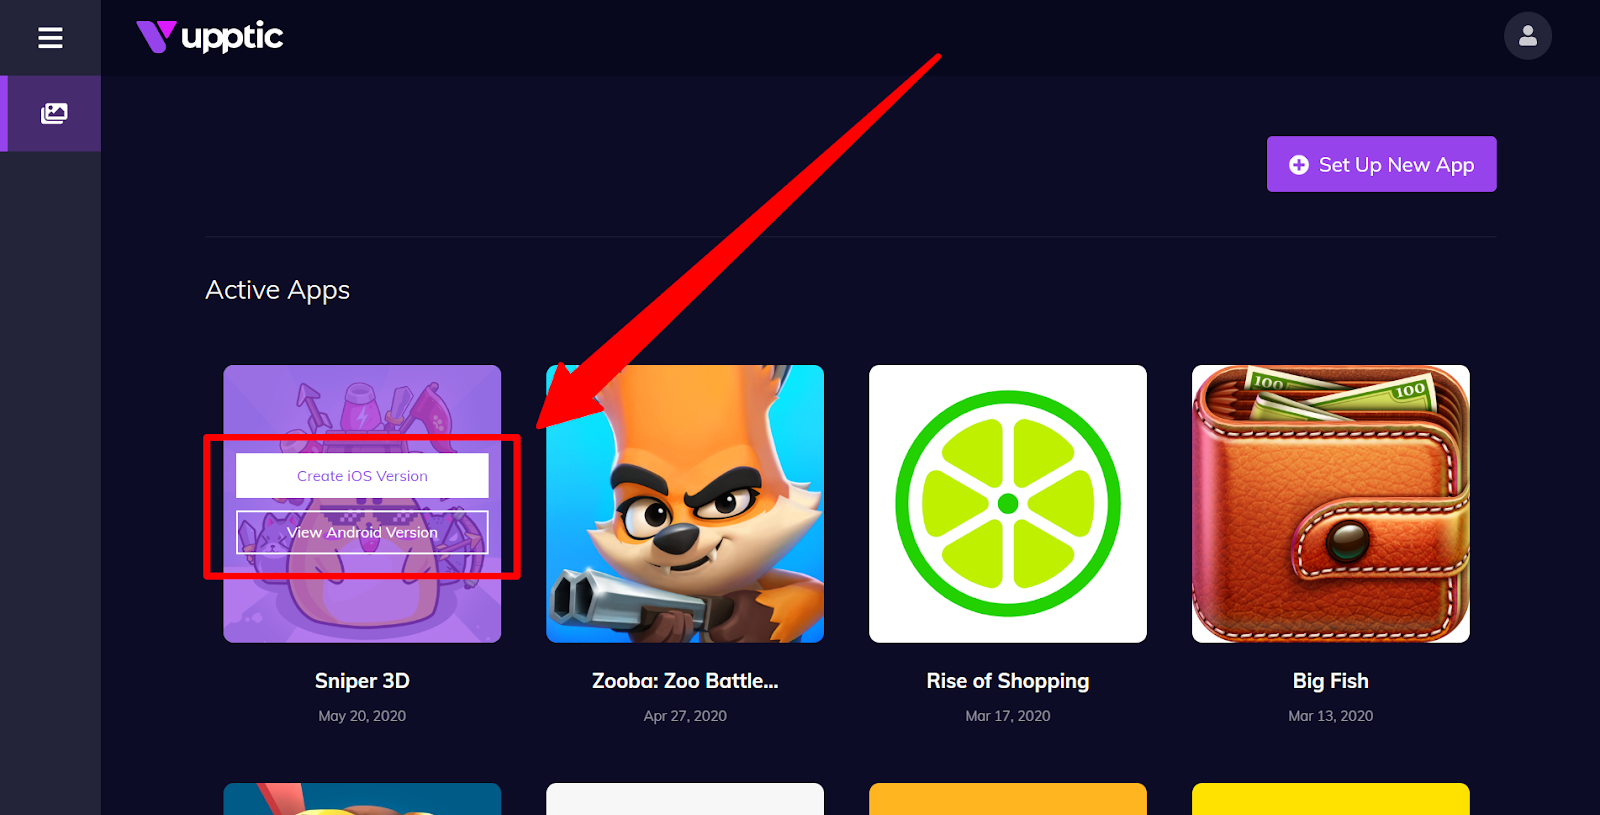
When you first log in, the left navigation menu expands to “App List” and “Set Up New App”. The App List page lists all the apps that are Active and Inactive. Hovering over each app let’s you view the iOS or Android version of those apps (or create them if you haven’t):
Once we click into an app, additional left menu options become visible: App Overview, Control, Elements, and Routing.
App Overview
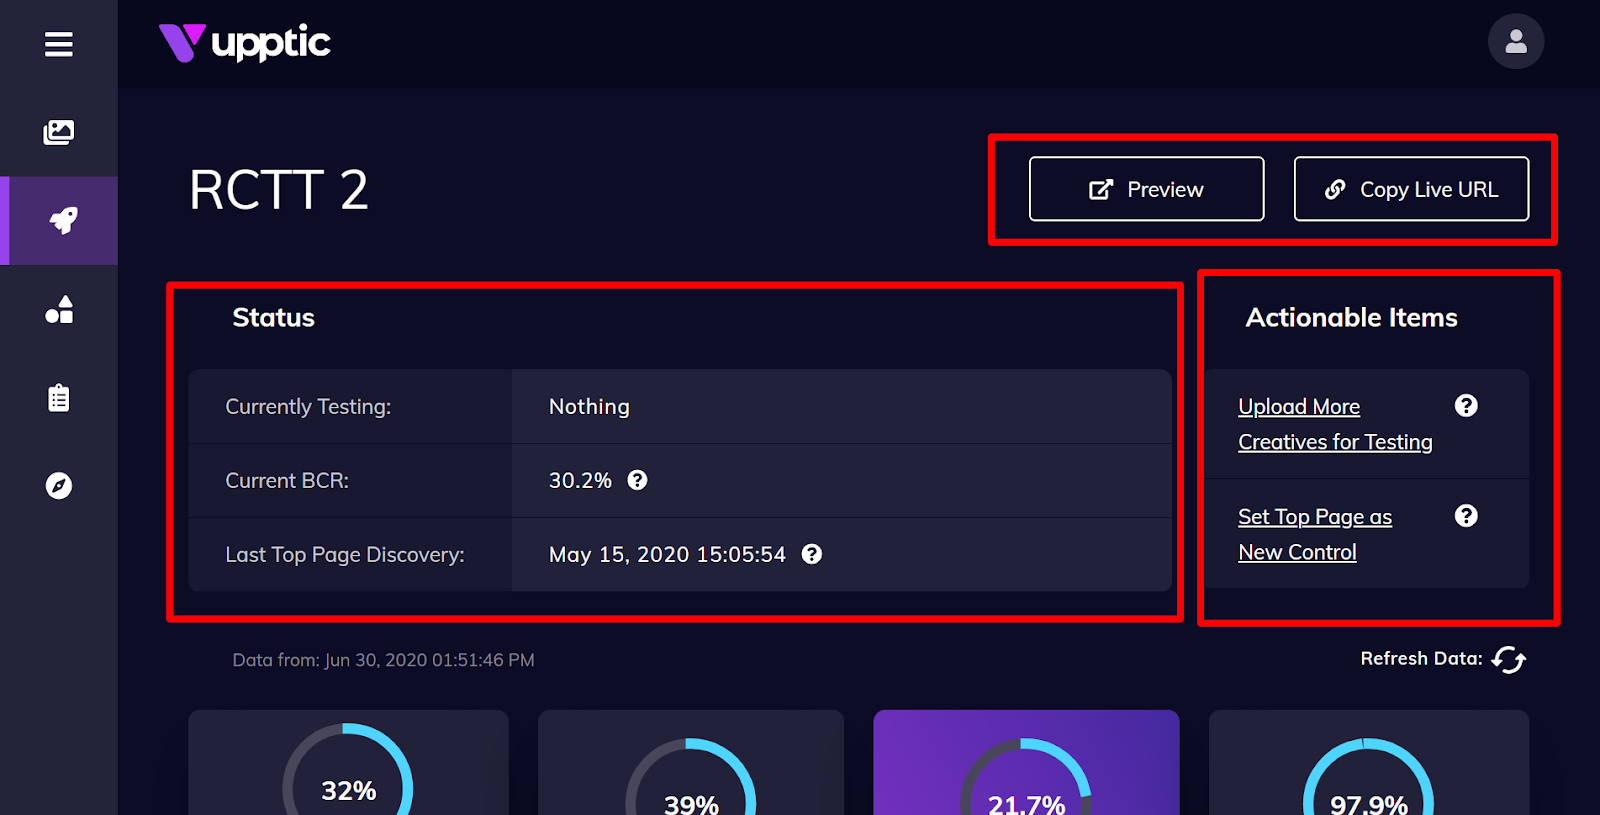
The App Overview is the main page once you click into an app. In the top right corner, there are 2 buttons: “Preview” and “Copy Live URL”. If you would like to see what the testing page looks like, use the “Preview” button. Clicking on “Copy Live URL” when you want to copy the actual URL to send traffic to for the UA media campaign. Clicking through the Live URL would log a click as an actual datapoint in the test.
The Status section will tell you exactly what the testing is doing at the moment. If Icons are currently being tested, then it will display “Currently Testing: Icons” and provide an approximate range of traffic still needed to complete testing. The Status section also lists the current Baseline Conversion Rate (BCR) and when, if any, the last non-Control Top Page was discovered.
The Actionable Items section lists the potential actions you could take at the moment. In the above example, you can always upload more creatives for testing (they would be queued if there are current tests happening) and set the current non-Control Top Page as the new Control. See below section on “Testing Flow” for more details.
Below these initial sections are tiles with the most important data. Below that is the “App Page Preview” section. This section contains a preview of the Control page (with a side scrollbar). If there is an optimal non-Control Top Page discovered, it would appear to the right of this:
Clicking on them would open the actual pages in new tabs. When there is a new Top Page, additional options will be available for you to take action on this discovery. Please see below section on “Testing Flow” for more details.
Below the App Page Preview is the graph. By default, it shows 2 lines: Control and Front-runner. Control is the performance of the Control, and Front-runner is the greater of performance between the Control and non-Control Top Page. It tells you what additional performance would have been achieved over the Control if the Top Page was implemented on any given day. There is a 3rd line, “Tests”, which can be activated by clicking on the name in the legend. “Tests” simply is the performance of all the testing, excluding the data that went to the Control. Finally, the 3 tiles at the bottom shows the total of all testing.
The last section, “Details”, of this page lists some details about the app, including the App Store URL, or destination URL, which can be edited if it needs to be updated.